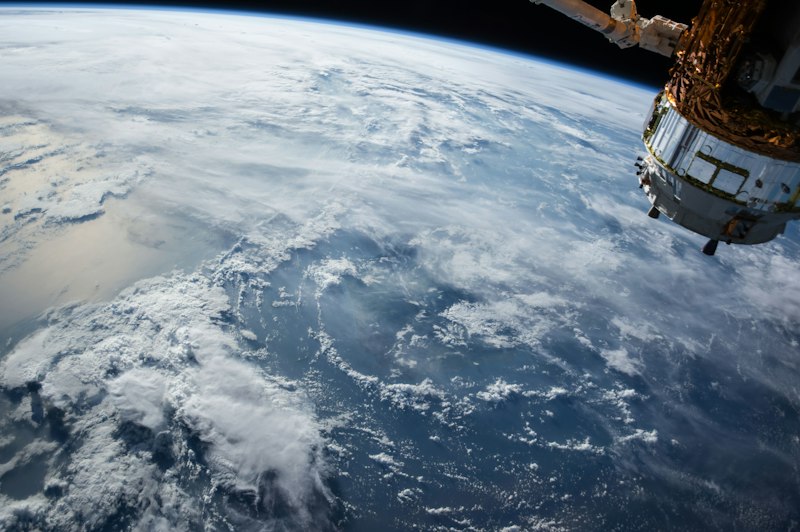
A satellite image of a river mouth lets a class follow the channel into the sea, trace islands, and see where nearby settlements sit. A diagram can label the process of deposition. Use the two together and ask students which parts of the diagram they can identify in the image.
Choose one feature for the lesson. An image packed with unfamiliar detail can leave students guessing what they are supposed to notice.
Separate observation from explanation
Make two columns: “visible in the image” and “possible explanation.” Students might observe a sharp boundary between green fields and bare ground, then suggest irrigation as an explanation. They would need more information to establish where the water comes from.
This distinction also applies to cities. An image may show a dense group of buildings beside a road junction. It cannot, on its own, tell you residents' incomes or why they chose to live there.
Check the date and scale
Find the acquisition date if the image source provides it. A harvested field and the same field during the growing season may look quite different. Comparing images from different months can introduce seasonal changes into what you intended as a comparison of land use.
Keep the scale similar when comparing two places. If one image covers a neighbourhood and another covers a province, differences in visible detail may come from the zoom level. Include a scale bar when possible.
A 30-minute lesson outline
- Spend five minutes collecting observations from an unlabelled image.
- Give pairs five minutes to propose a location or explanation and record their evidence.
- Reveal the location and spend ten minutes comparing the image with a map or diagram tied to the lesson.
- Use the final ten minutes for a second image and an individual written explanation.
You can use a satellite geography game for the guessing stage. Prepare a separate image when the lesson requires a particular feature or date, so the teaching objective does not depend on a random round.
Ask questions the image can help answer
For a delta, ask where the channels split and where sediment is visible. For farmland, compare field sizes and the position of roads. For an urban edge, ask students to trace where continuous development gives way to fields or open land.
Then ask what is missing. A rainfall record can help explain vegetation; a historical map can help explain a street pattern. Students should be able to name the extra evidence they would need before treating their interpretation as a conclusion.
Assess an explanation on a new image
Use a different view of the same kind of feature for the exit task. Ask students to mark it and explain how they recognised it. Keep the original image available for comparison if the goal is interpretation rather than recall.